Quantifying Wants, For Better Outcomes
Basic economics for slightly better decisions - know your utility function.
Tl; DR: I find decision-making hard, but it got slightly easier when I thought more deeply about my utility function.
I find decision-making messy and hard. When one is lucky enough to be blessed with good options at life- or career-level turning points, I tend to feel a significant and highly distractive amount of stress when optimising for the best outcome. I also think that a similar, maybe even more intense, kind of stress happens even after I make decisions. In my life, I think that the peaks of this kind of mental stress tend to manifest a few months after big decisions when I need to stick by them, even when every other choice feels like it would have been better.
I can’t find a better example of this choice anxiety than when it comes to career choices. In 2022, I had a fairly binary career choice:
I received an offer to join the Entrepreneur First programme, an accelerator where you can find a co-founder to start a startup.
I also had an opportunity to continue down my current route of systematic trading.
Which was the better choice? This decision caused quite a lot of anxiety. For me, this was an exercise in decision-making under uncertainty. (Spoiler: in the end, I chose to continue trading). In this post, I aim to highlight what I learned about my own decisions, along with some basic theory.
Good career decisions depend on what your Utility function looks like
I attempted to model this choice using some basic utility theory to ease my anxiety. I currently hold the view that, in general, economics models are usually bad but do still provide a basic framework for thinking. The utility function, a fundamental technique in economics, is a way to map different inputs to a real number - this real number represents the welfare that you get from a given situation. A well-defined utility function allows people to systematically order choices, from good to bad, based on which choice offers higher ‘utility’. The utility function can have many different types of things to input, but it should output a real number of which we can compare several choices. Choices with the highest utility are more optimal. If you were a completely money-minded, your utility function would look something like
When trying to decide the best course of action, I realised that I didn’t have my exact utility function clear in my head. This, in hindsight, seems like the most obvious thing to do - after all, how can we decide the best thing for ourselves without having a clear idea of what we want? I also discovered that writing down your utility function is far from trivial. It’s not straightforward because it’s hard to value someone’s preferences quantitatively. This post is partly my attempt to clarify to myself what my utility function looks like, especially from an income point of view, and share some thoughts about stuff I didn’t know about myself along the way.
While I think the utility function between people will vary wildly, I think there are bound to be common points that unite the population. With decisions that concern my career, I think that to first order my utility function looks like this:
Utility = function of (income distribution, passion, hours of work).
For this post, I’ll focus on the form of the utility function restricted to my income distribution. What might surprise you is that my utility function depends not on income alone but income distributions. Income distribution is meant to capture the shape of probable income values across their possibilities. For example, does one have a distribution where my income is like a biased coin flip, between 0 and 1 million (sounds like a lottery user), or a steady distribution with little variance and high conviction - NHS workers’ pay is essentially deterministic and grid-based?
I use the word distribution because it is more general than a term for fixed, predictable income. For many jobs, income tends not to be completely deterministic but has aspects of randomness, especially in entrepreneurial or performance-based roles. For example, a portfolio manager’s compensation is a function of their trading profits at the end of the year, which is inevitably a combination of skill and luck. Someone’s income post-promotion depends on negotiation skills and random elements like their likeability with colleagues. A distribution function shows my income and probability density, where the most likely outcomes are associated with a higher value.
With this distribution function, we can pick out certain traits we can value for our utility function. For example, one obvious property that one could care about is the mean or average of the distribution. However, there are other characteristics that we might find appealing.
How ‘spread out’ is the distribution? This quantity is the standard deviation and is the expected value of the absolute income distance from the mean.
How fat is the right tail on the extreme? A distribution with a fatter right tail means that proportionally, very large values are comparatively more likely than a distribution with a thin right tail. This quantity is also called skewness and measures how much the average of the distribution differed from the median.
How fat is the left tail?
In fact, with the same mean, you can have different skews and variances. I think that this kind of difference characterises what is going on with people who sacrifice steady incomes for riskier endeavours. The diagram below shows distributions with the same average but different degrees of skewness. In the blue distribution, the most likely scenario is that you end up with less, but have a potentially bigger upside where the benefiting from the right tail is more probable. I would fuzzily equate this kind of distribution to the kind of reward a startup-founder, or prop trader with might expect. This is the kind of distribution where you are sacrificing a higher median income for a chance to win really big.
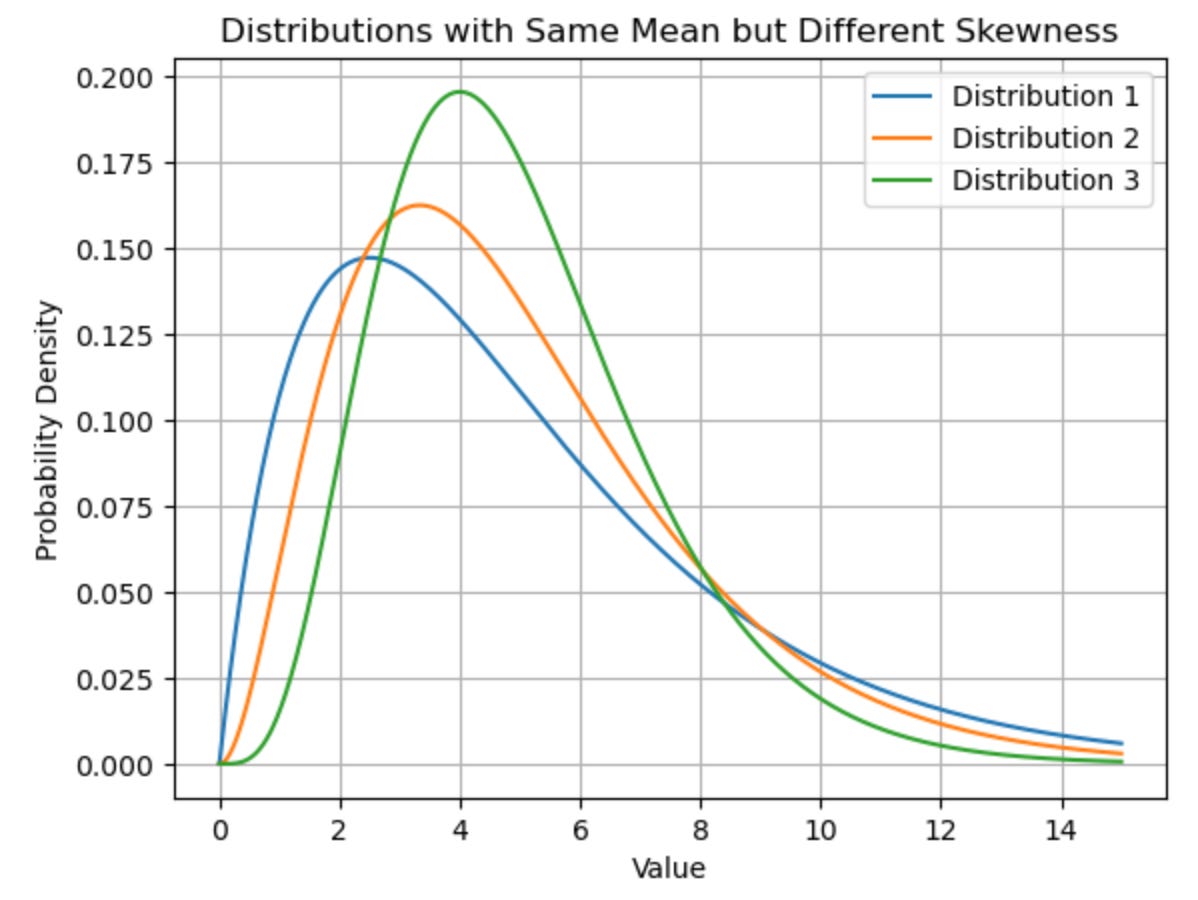
On the other hand, you also might prefer the green distribution, where the most probable scenario is higher, but you sacrifice a potential larger upside.
The right tail discussion, I think, is quite interesting - often in finance, portfolio managers will aim to maximise a utility function that balances risk and reward. In this case, the risk is usually some function of variance and mean, and we can maximise the following quantity.
Utility = expected return - risk aversion * standard deviation
However, this utility function doesn’t consider the right skewness of the distribution. I think that the skewness level in distribution is a pertinent enough feature to take seriously in your utility function. People hungrier for the more extreme end of the right tail distribution would prefer to take their chances and settle for more heavily skewed distributions to the right. I think entrepreneurs or proprietary traders who are prepared to accept a relatively lower median scenario for the potential large upside (more than you can get from being a highly paid dentist, for example) prefer these types of skewed distributions.
In summary, when it comes to income, I guess my utility function looks like something of the form:
F(income distribution) = mean income + lambda_1 * standard deviation + lambda_2 * positive skewness
I think for now, lambda_2 is quite large for me, but not large enough yet to really get into the startup life (even assuming that the mean expectation of income is the same).
I'm curious about how you can work with lamda2, how much value you place on the slightly higher chance of finding yourself in the fat tail. Surely this is one of the hardest things to reason about, and is likely very dependant on your personal psychology. Is there some objective way to measure or select a better utility function to balance the mean income vs fat tail potential?