Measuring Milk Globule Sizes
It's not straightforward!
Thanks to Kevin Lynagh for helping me out with this and the suggestion to use a hemocytometer. Check out Kevin's blog, it's sick!!!!*
In my last post I tried to replicate the physical relationships found from Brownian motion (Improved Tracking Of Brownian Milk Globules). I explained that the diffusion relationship tells us how far something is meant to travel in a heat bath as time goes on.
⟨Δr²⟩ = mean squared displacement - the squared distance something travels
d = dimensions — in this case we are approximately in 2 dimensions.
D = diffusion coefficient
k_B = Boltzmann constant
T = temperature — room temperature.
η = viscosity — water at room temperature, η ≈ 1.0 × 10⁻³ Pa·s (1.0 mPa·s at 20 °C)
a = globule radius.
The diffusion constant is a function of the radius of the particle in water. But last time I didn't measure the radius of the milk globules that I used. So in this post I'll go through an attempt at doing that. As usual, it's not that straightforward!
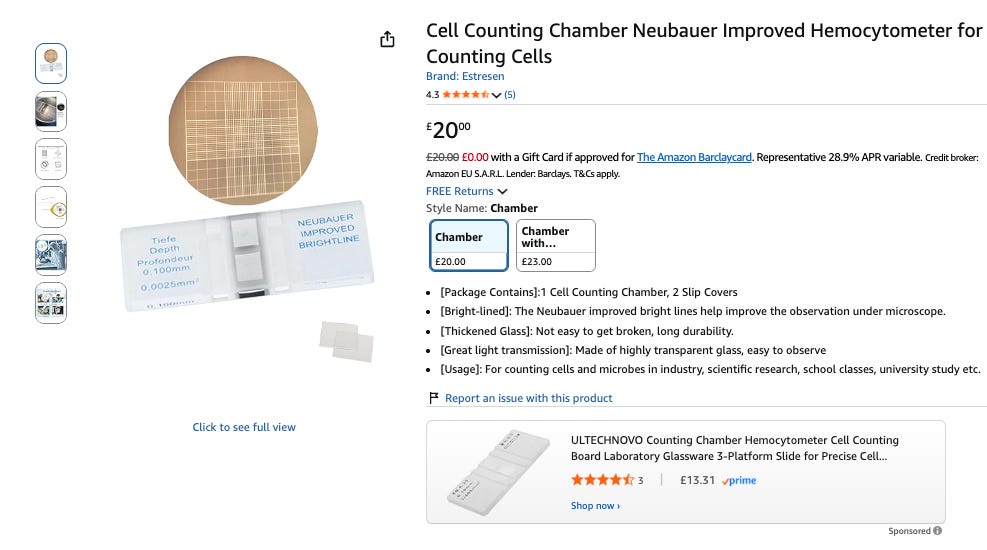
So to estimate the radius of the globule I bought something called a hemocytometer which is originally used in medicine to count the density of cells in a sample. The grid spacing in between is fifty micrometres by fifty micrometres (0.05 mm × 0.05 mm, area 0.0025 mm²). Given that estimates of milk globules I read online were from around 2 to 20 micrometers, I thought this would be a decent start.
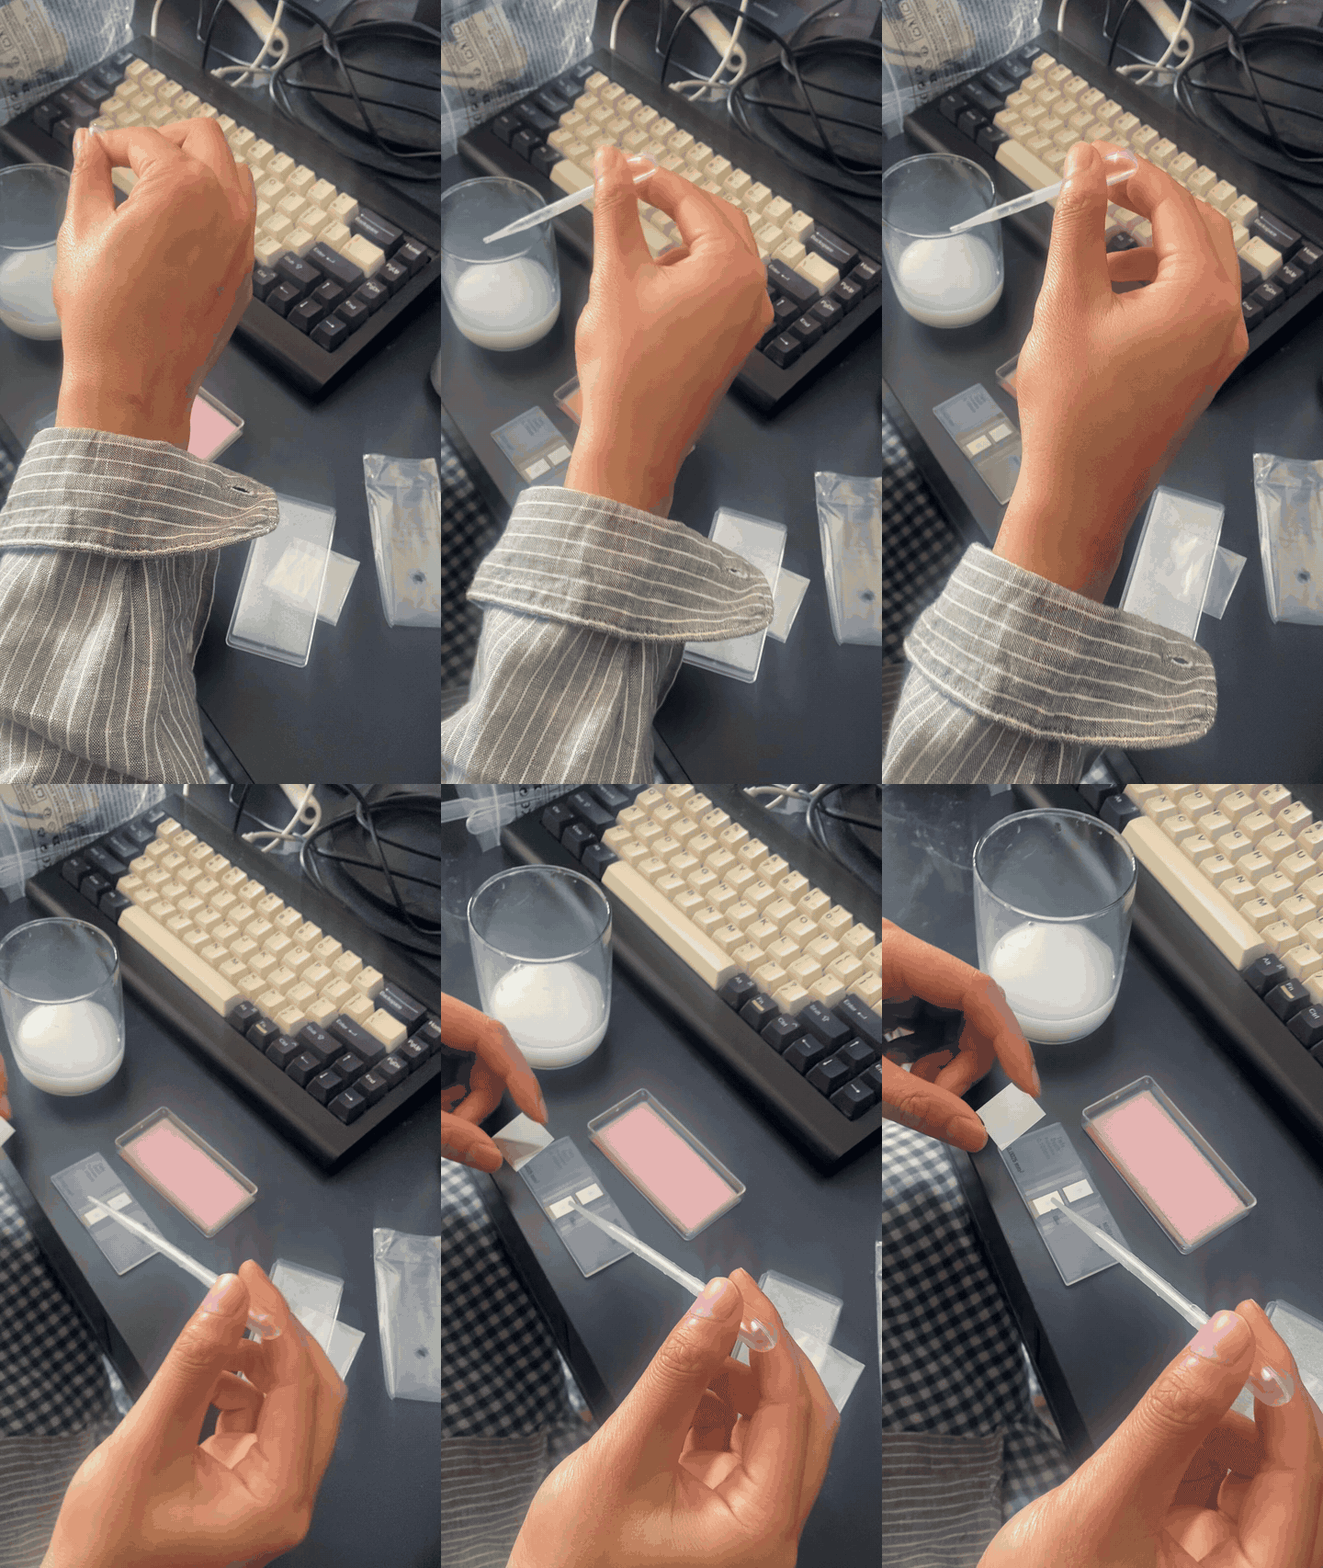
So once this arrived I diluted milk with one part milk and 10 parts water, and then pipetted it onto the cell counting slide.
Then I put on the cover slip on top.
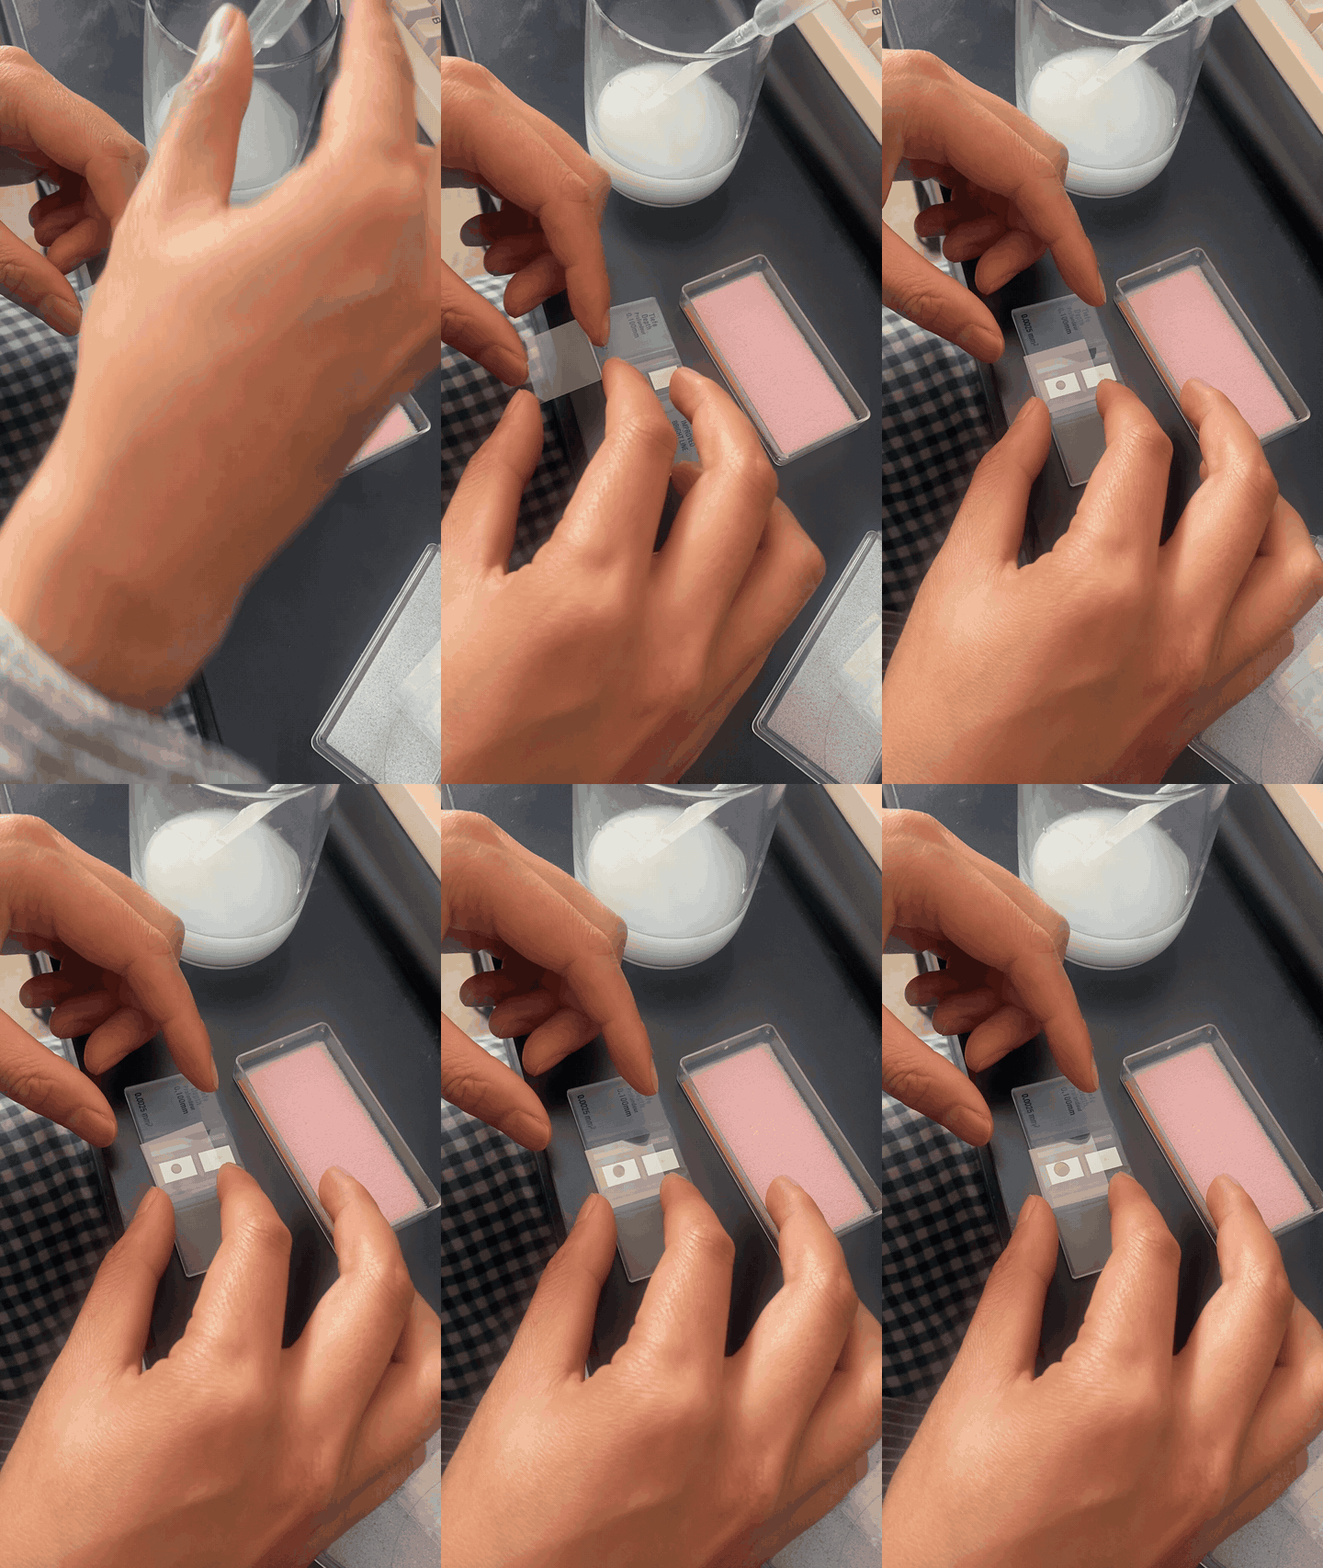
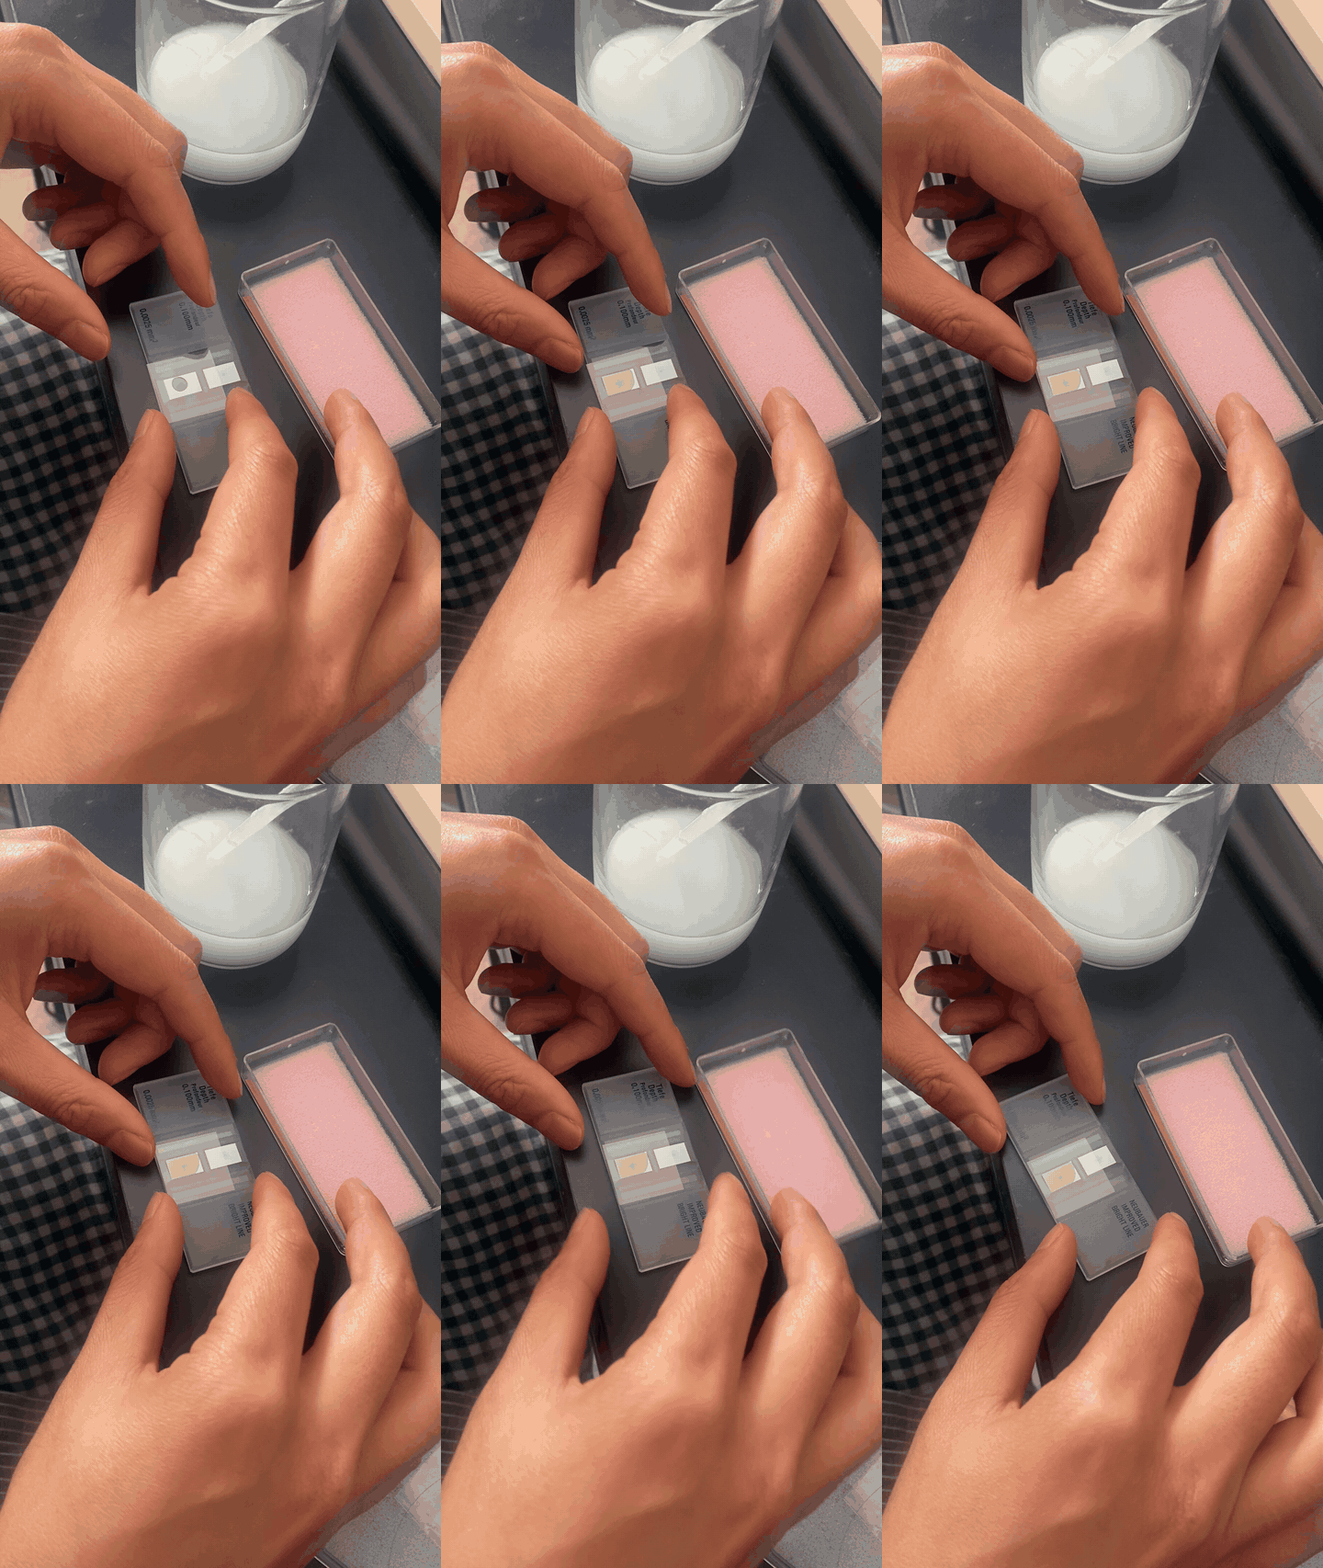
It's a bit fiddly, but when you put the coverslip on top, the sample of milk spreads out.
Then I used my microscope which I wrote about here. At the first level of magnification you can see the white line spacers that are meant to show increments of 50um each, along with the dark spots that are the globules.
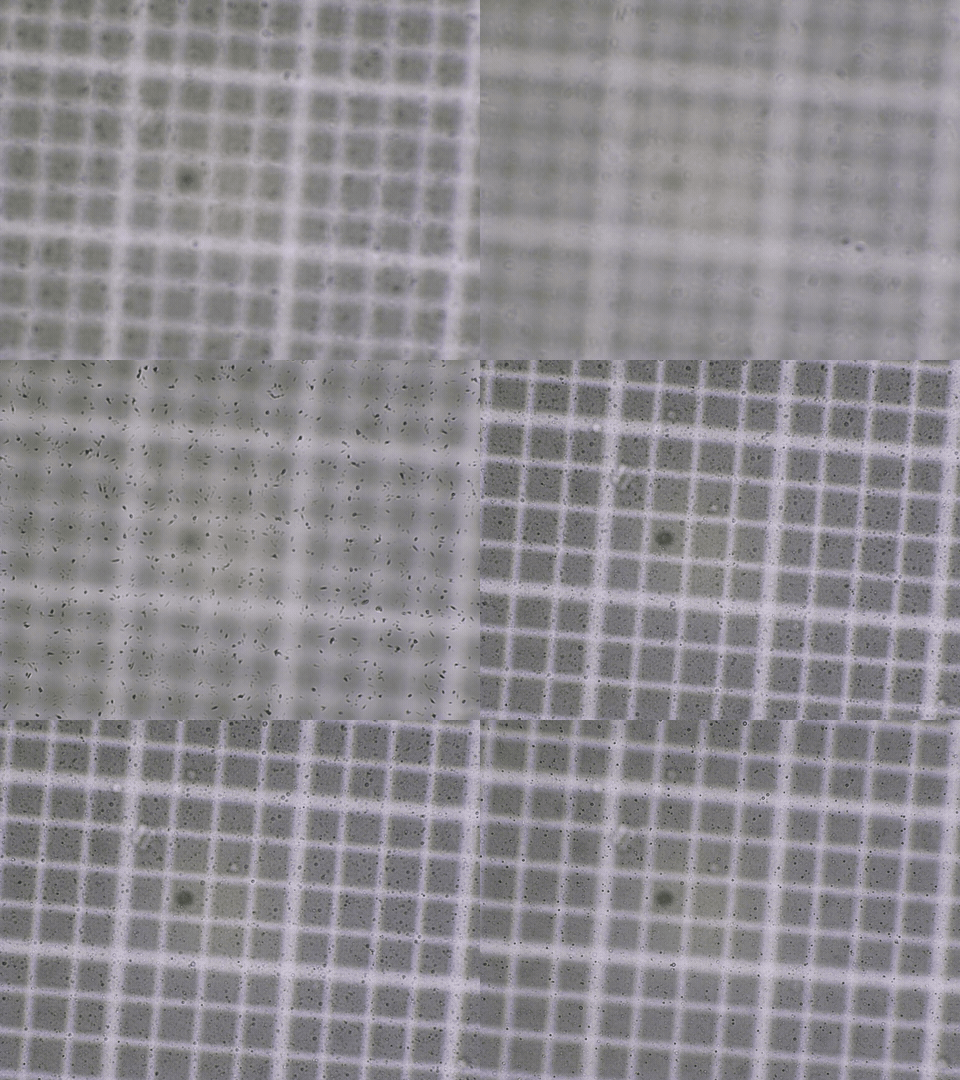
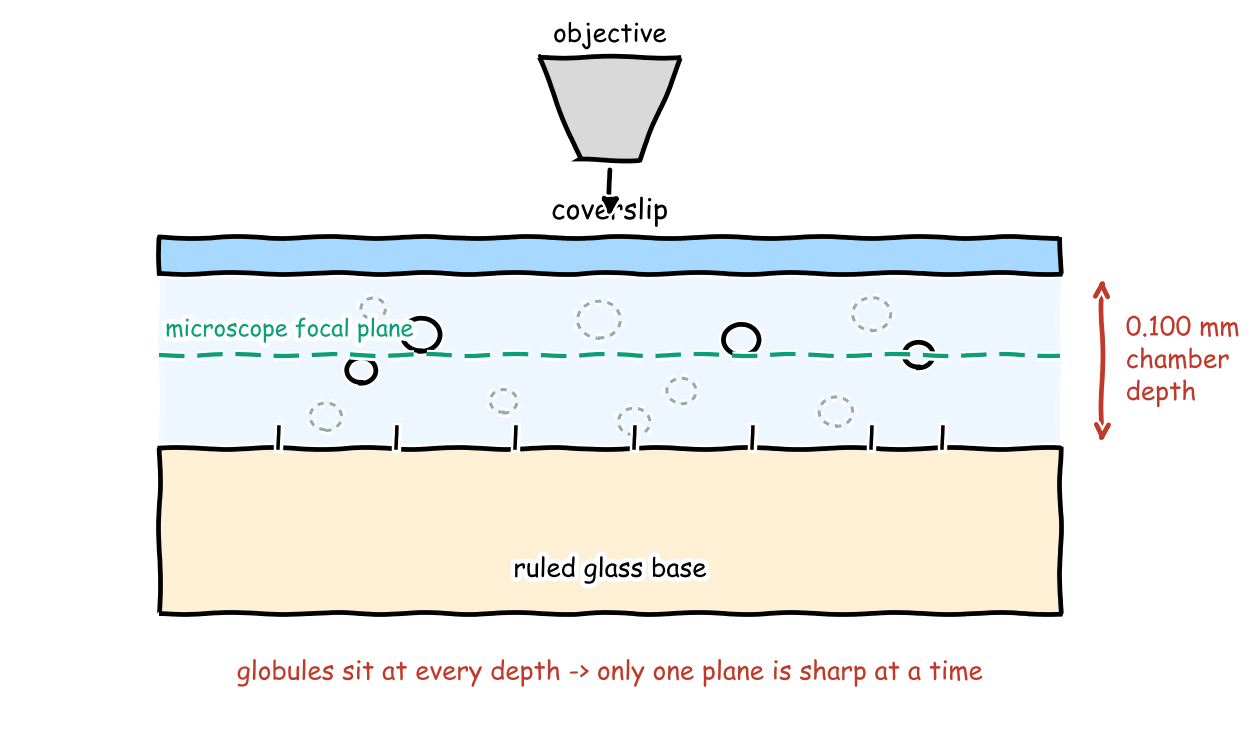
And then magnifying to 40x we can see the size of the globules a bit better. One of the problems is that it's hard to get both the lines and globules focused at the same time, as you can see below in this gif.
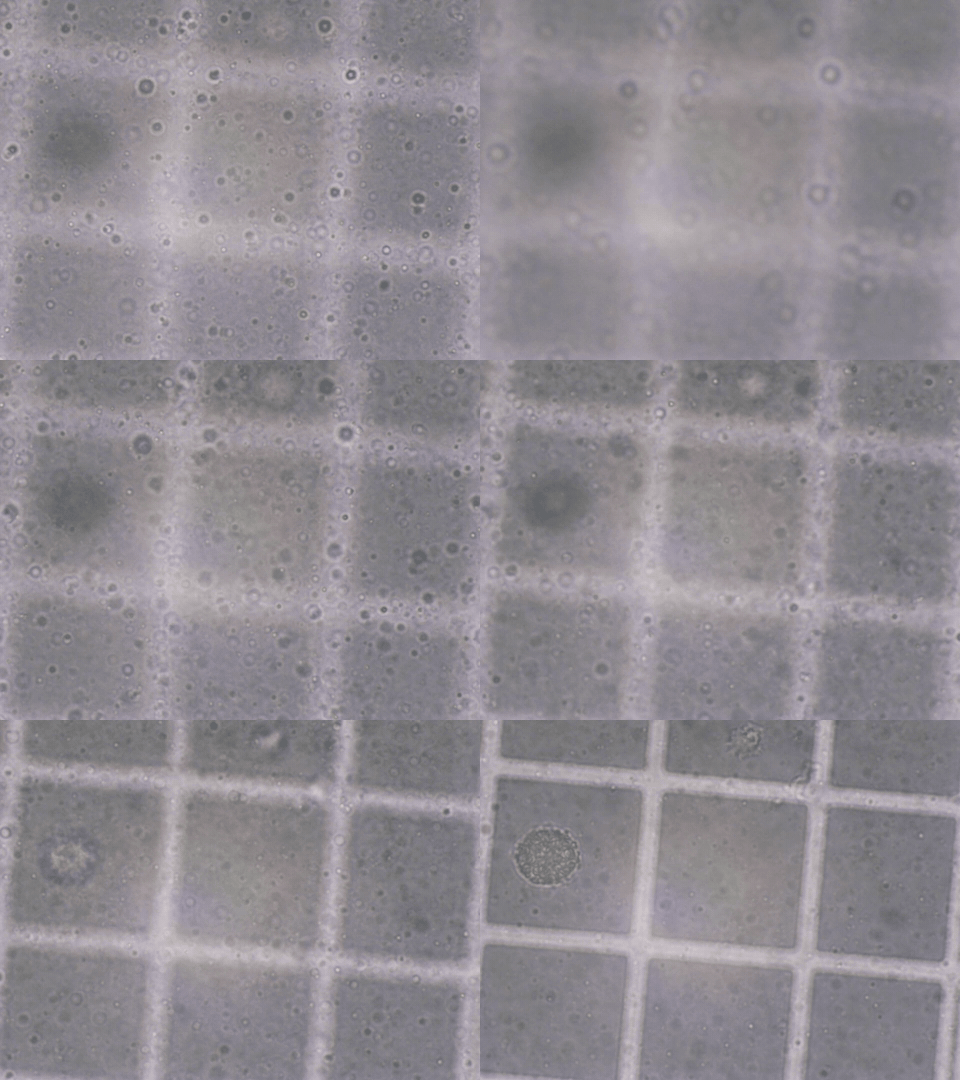
Here are some pictures at varying levels of focus:
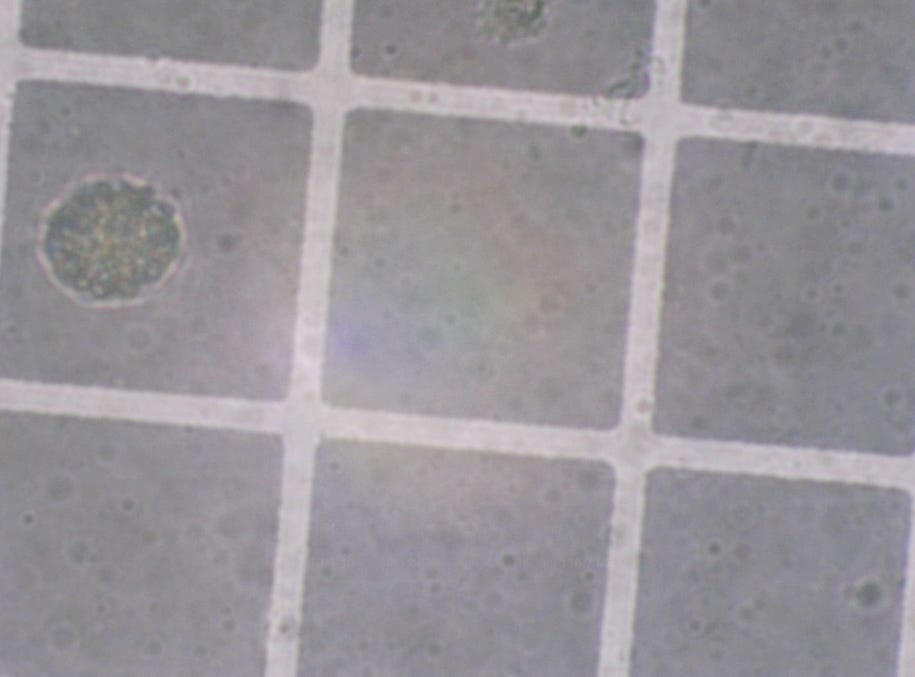
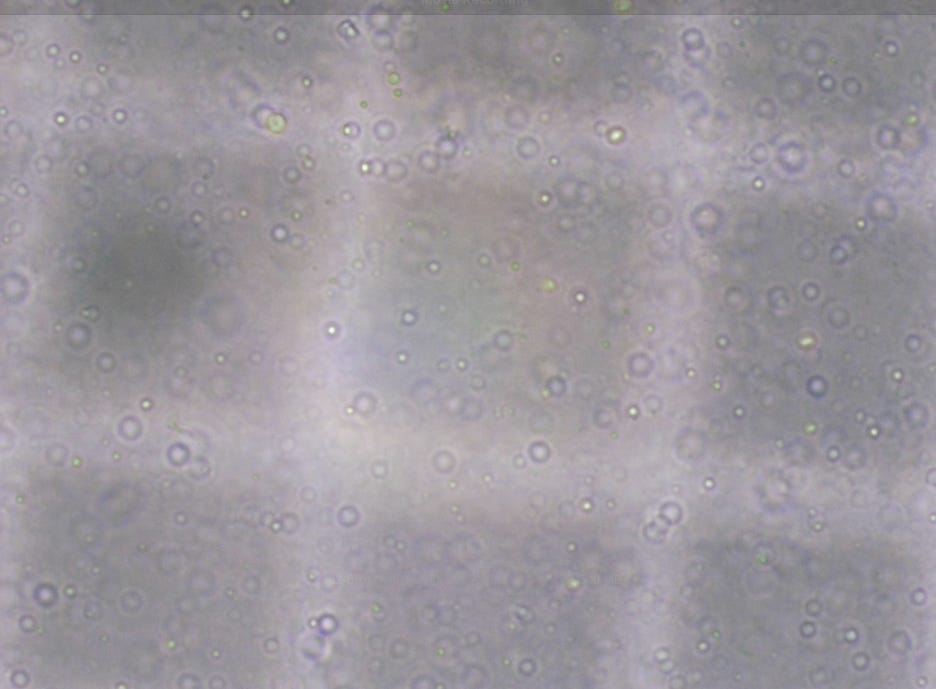
So to measure the globules I got Claude to write a program that matches the distance between the white lines, to the number of pixels in the image.
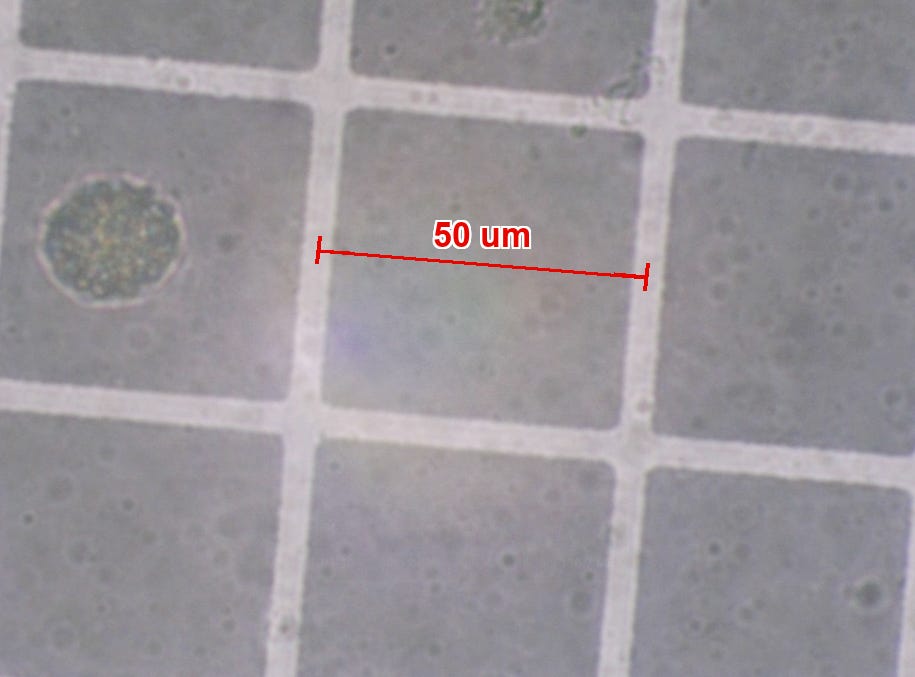
So at this scale from grid: 326 px = 50 µm, which means we have 0.153 µm/px. And then using some image recognition in Numpy I could get the diameters of the globules.
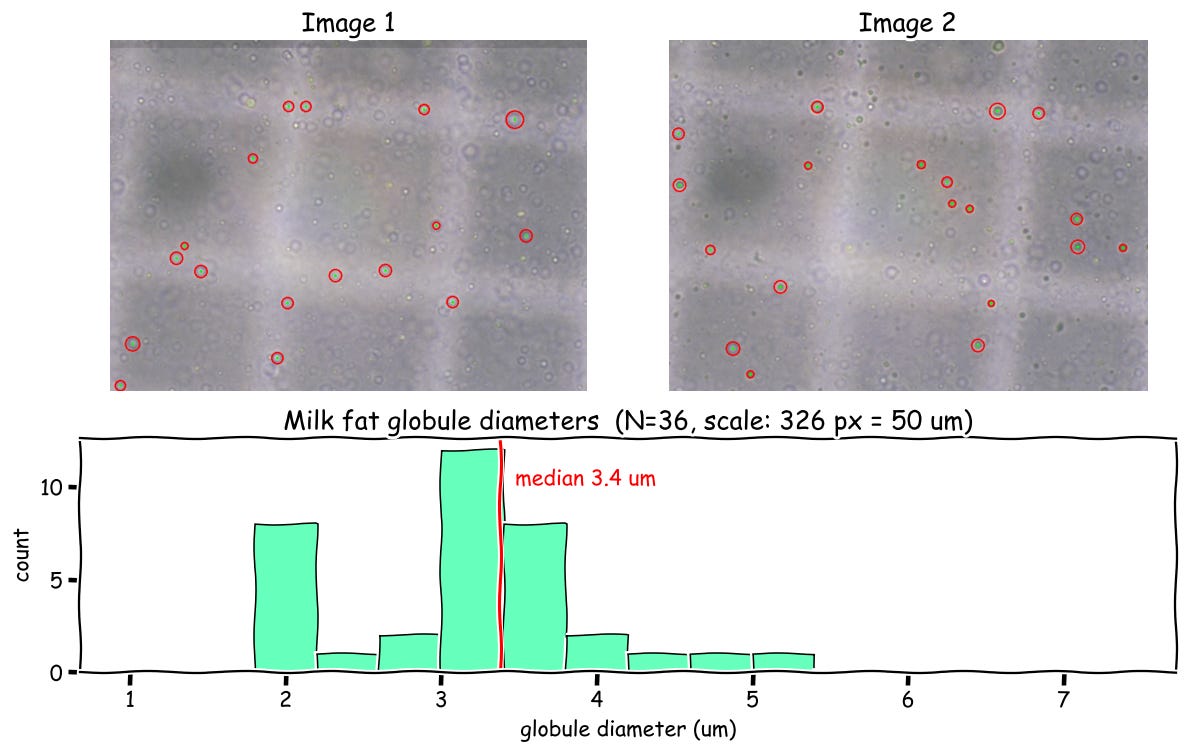
So in terms of data I found that the clean measurements gave me a set of:
N = 36 globules
median = 3.4 µm, mean = 3.2 µm, std = 0.8 µm
interquartile range 2.7–3.7 µm, full range ~1.8–5.2 µm
Ok, so that makes sense.
But here are some issues. The size measurement is janky because there are multiple depths, shown in the image below, and I'm not sure how to count these properly. How do I know that there isn’t some depth variation as a result of the thickness of the slide, especially with stuff so small like milk?!
Cell density measurement is a little trickier. There are a lot of globules to count. A lot of the globules are faded and those are really hard to pick up just with image software. I have some ideas on how to fix this but that’s for a different time.
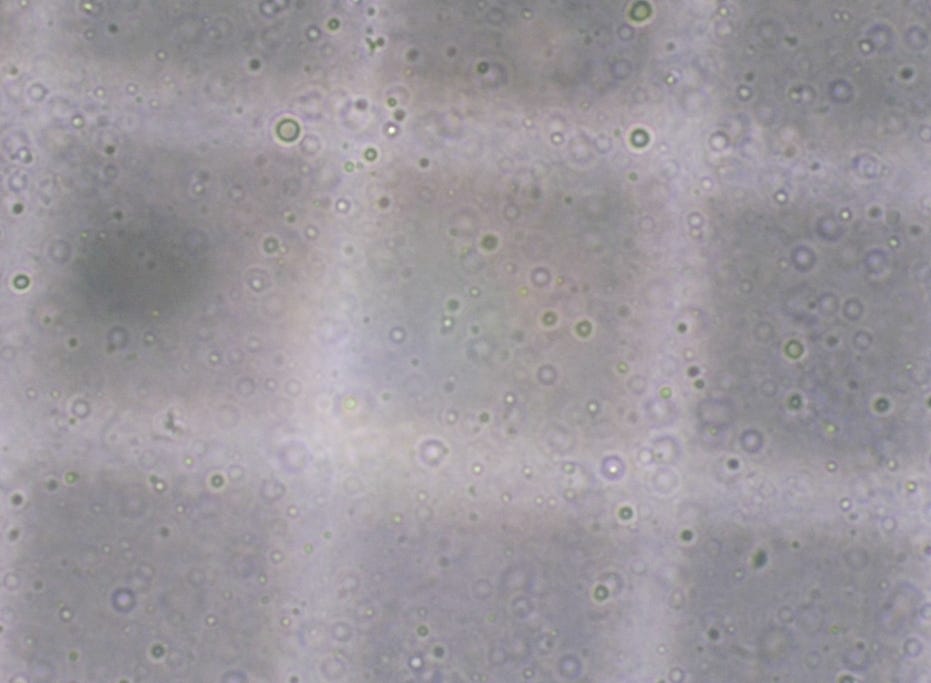
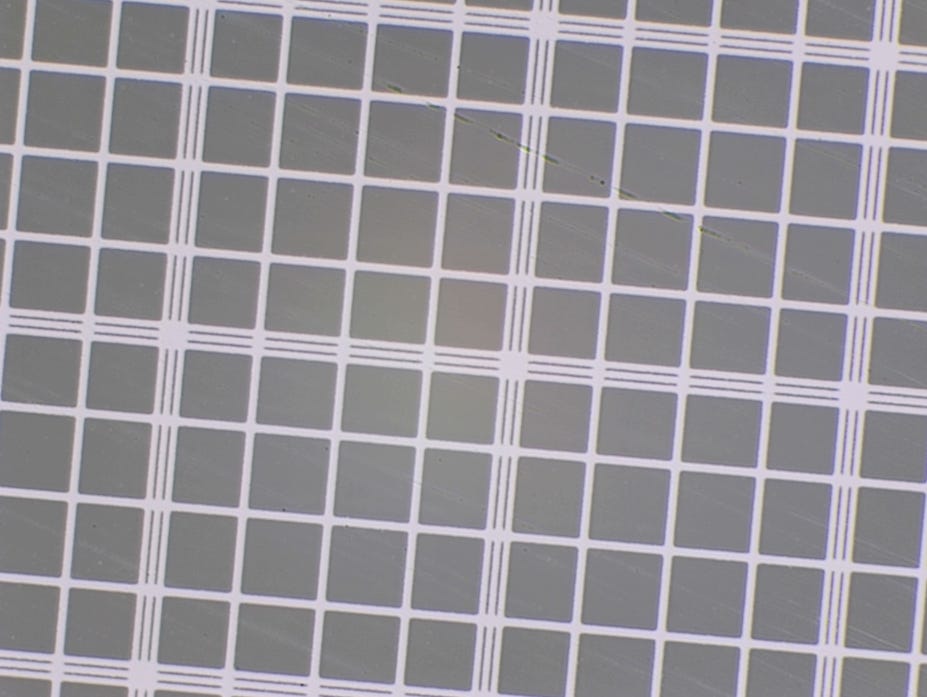
Also, since I don't want to buy a cell counting slide every time I do an experiment, I had to clean the counting slide. To clean it, I just poured mineral water from Tesco over it in the sink. Then I used a glasses lens cleaner and gently dabbed it. The result after cleaning is in the picture below, you can still see some scratches!
In the future I want to measure some other cell sizes, like algae and yeast. Stay tuned!